Internal Data Dashboards
Note: Internal data dashboards are only accessible by SBCC staff or faculty. For questions, contact ir-group@sbcc.edu
Quick Dashboard Access
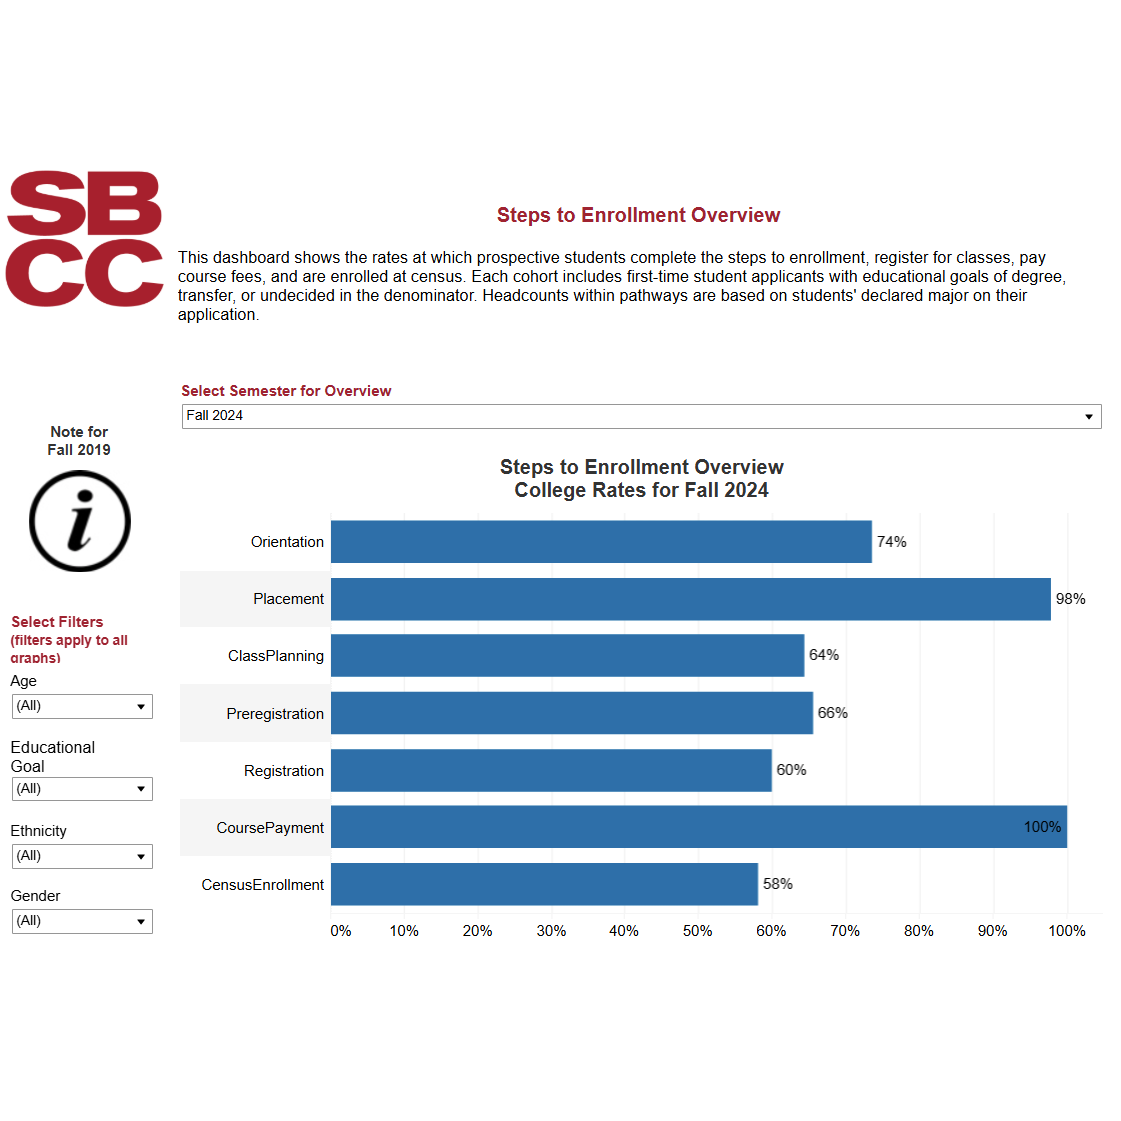
Access - Steps to Enrollment
Percentage of prospective students who complete the steps to enrollment. Filter by
term and various student characteristics.
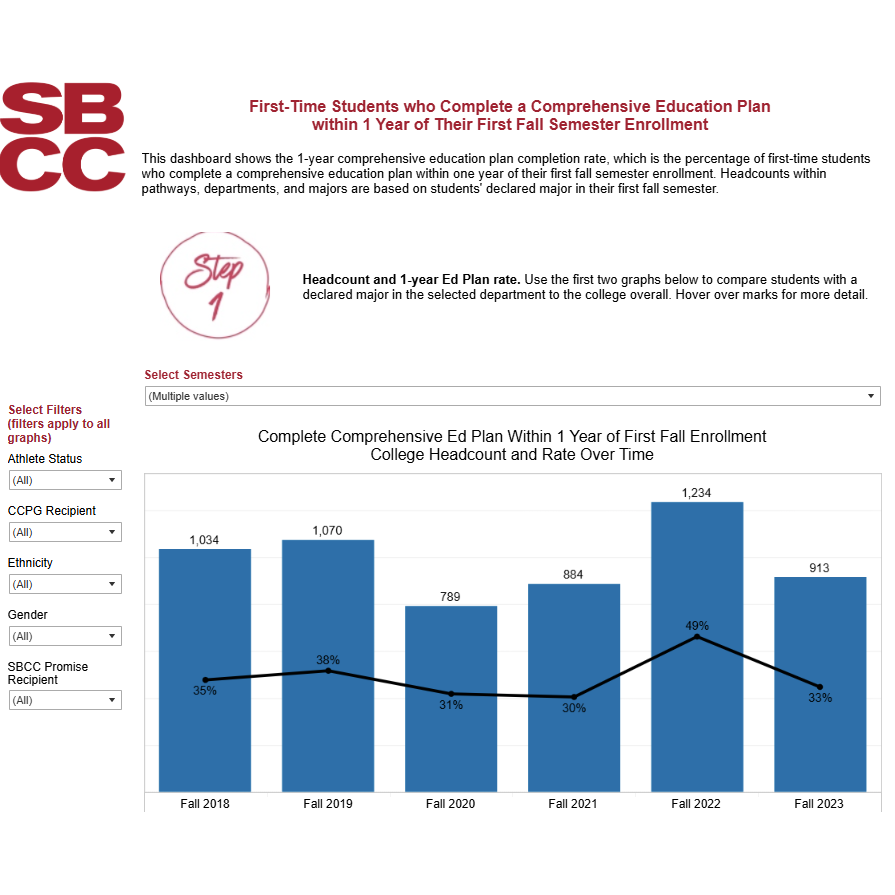
Progress - Comp Ed Plan
Percentage of first-time students who complete a comprehensive education plan within
one year. Filter by term, program, and various student characteristics.
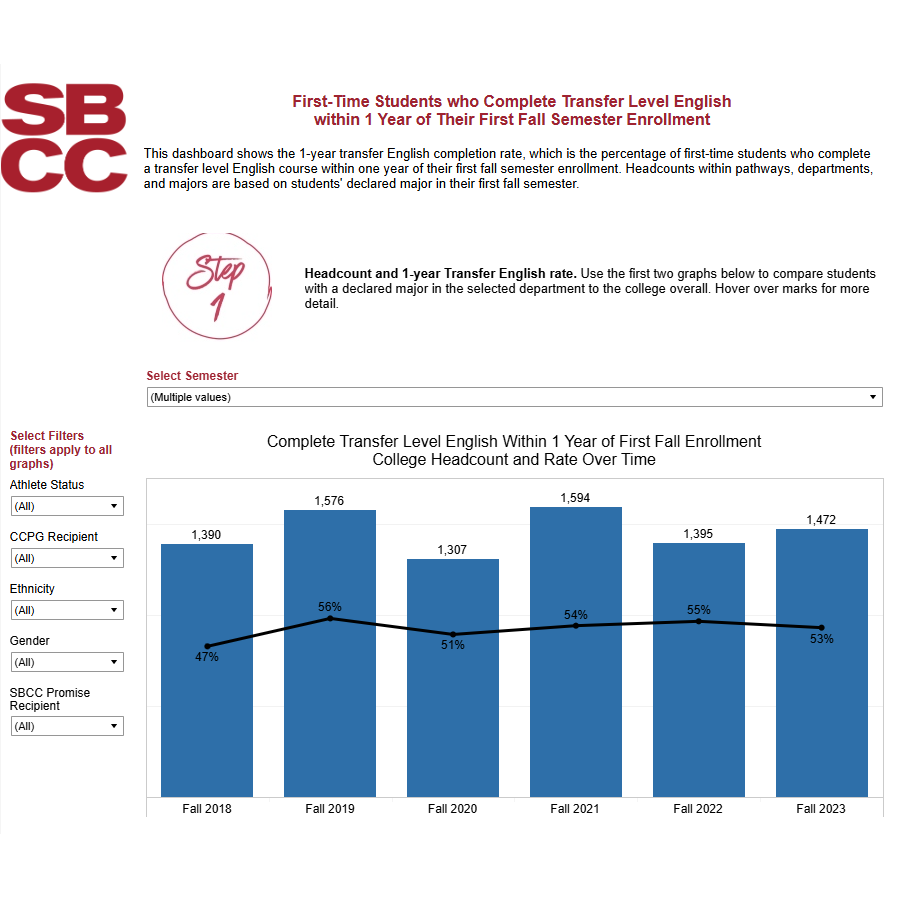
Progress - Transfer English
Percentage of first-time students who complete a transfer level English course within
one year. Filter by term, program, and various student characteristics.
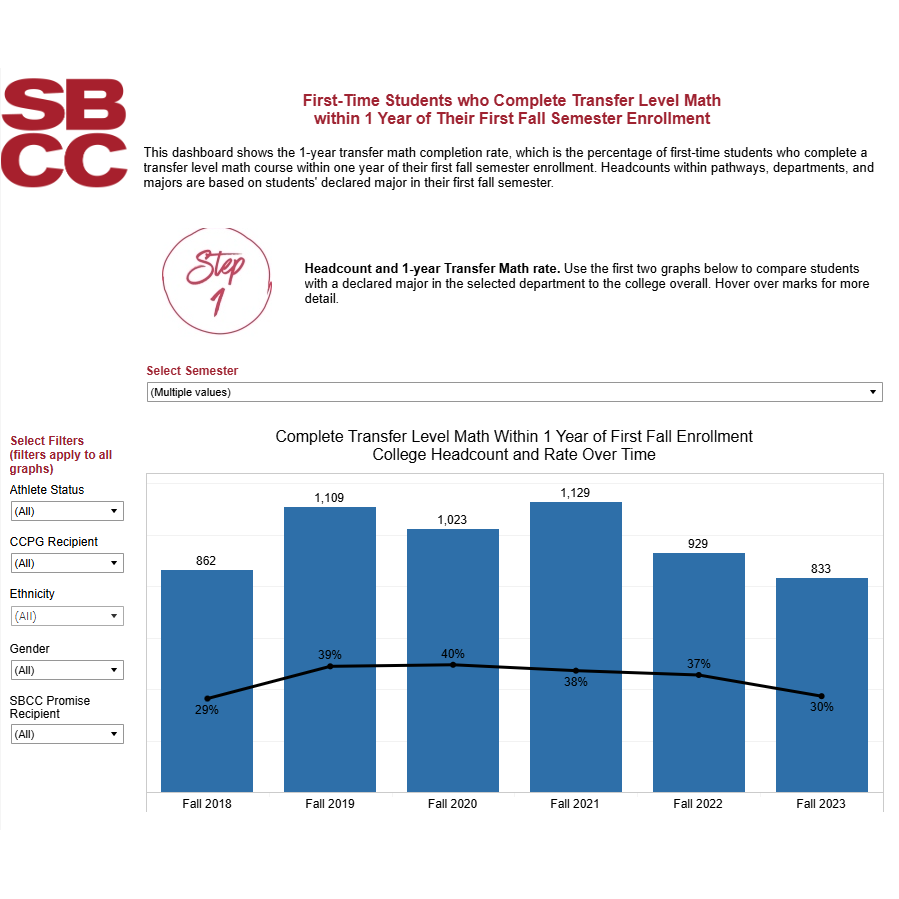
Progress - Transfer Math
Percentage of first-time students who complete a transfer level math course within
one year. Filter by term, program, and various student characteristics.
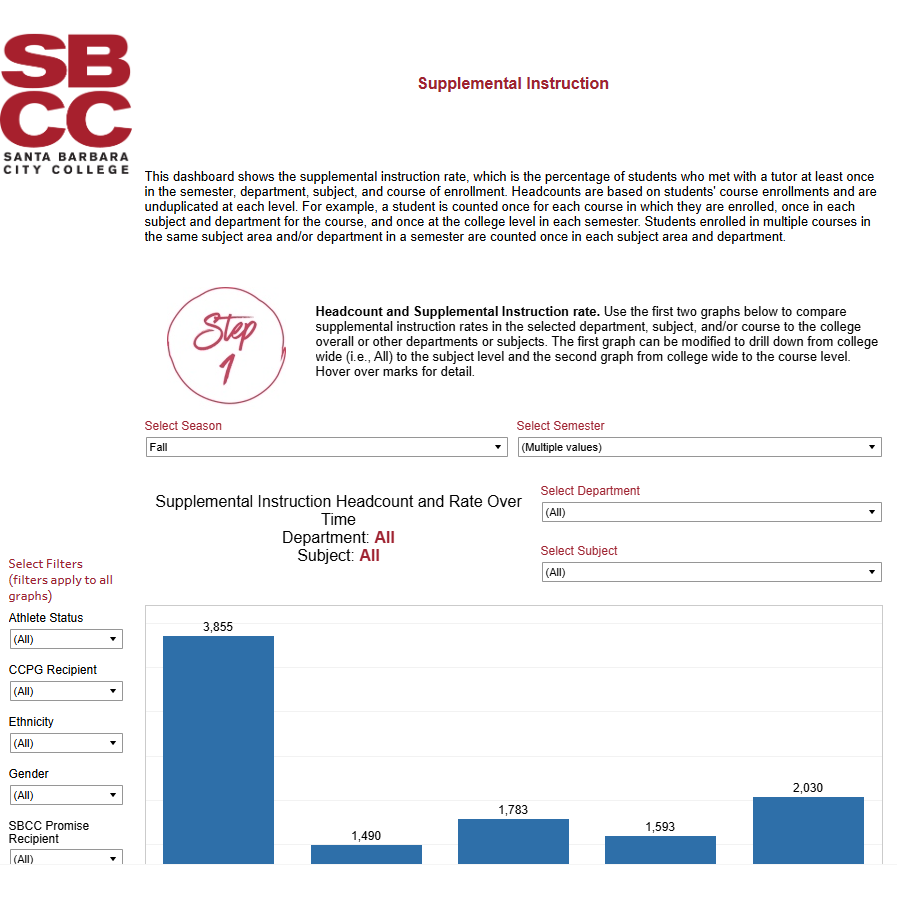
Progress - Supplemental Instruction
Percentage of students who met with a tutor at least once in the semester. Filter
by term, department, and various student characteristics.