Data Center
SBCC stakeholders can access dashboards and reports that tell the college's story of student access, progress, and success. Find data on student enrollment and demographic trends, course success, persistence, program completion, and more. Coming soon: the general public will soon have access to FERPA compliant student access, progress, and success dashboards.
Tableau Dashboard Login*
*For internal campus community use only
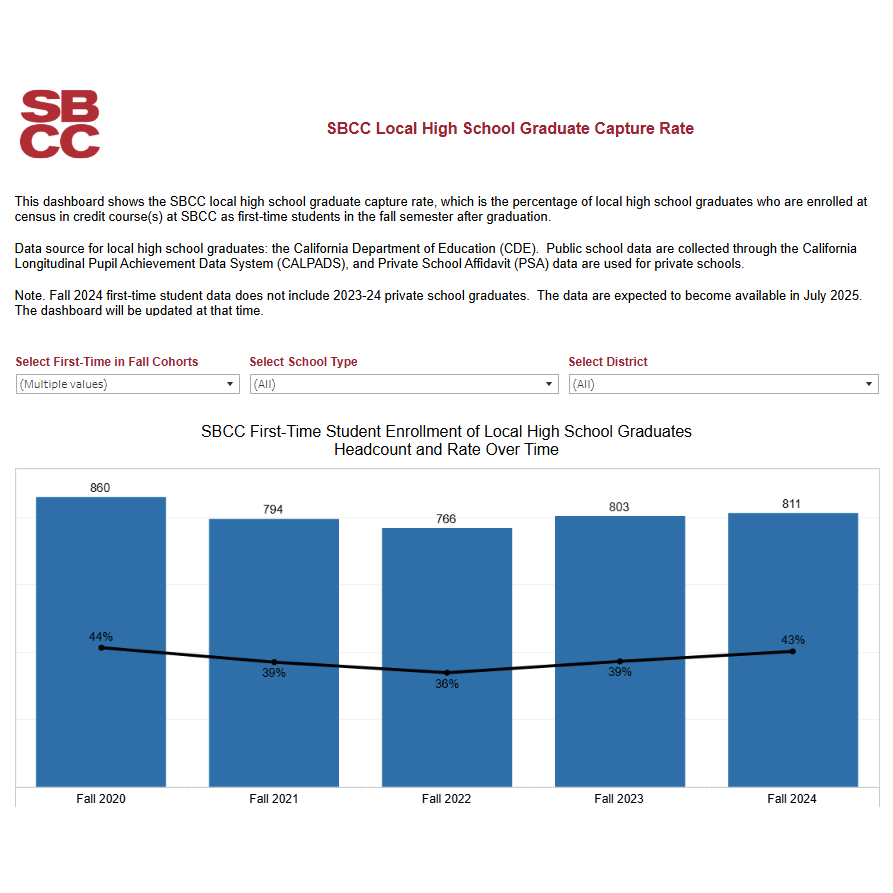
Access - High School Capture Rate
Percentage of local high school graduates who enroll at SBCC in the fall semester
after graduation. Filter by term, district, and school.
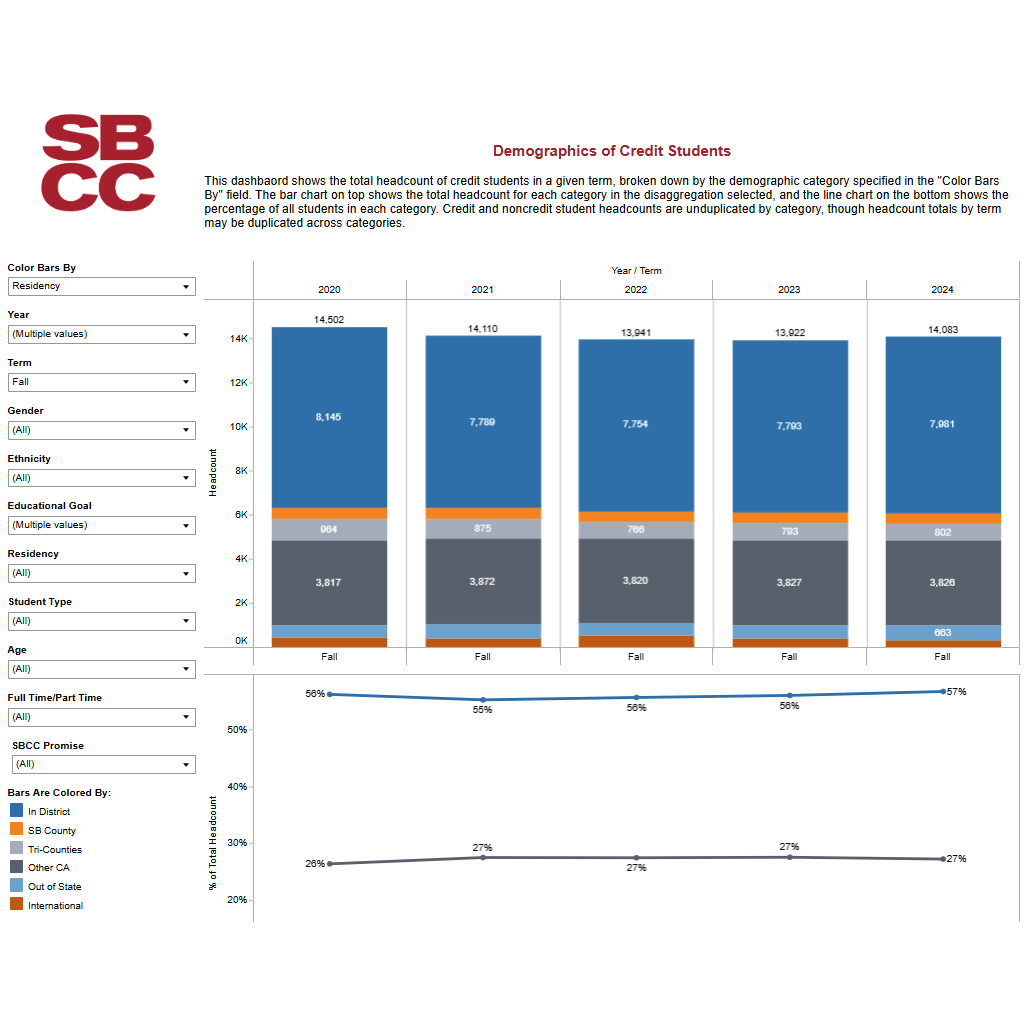
Demographics of Students
Credit and noncredit headcounts disaggregated by various student characteristics.
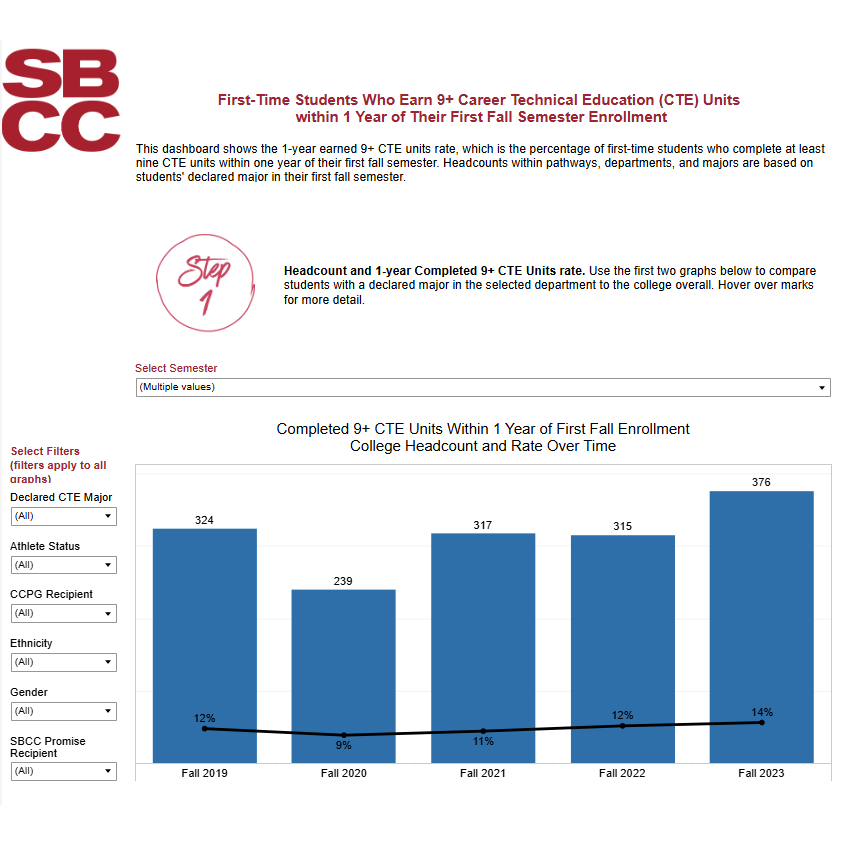
Progress - 9+ CTE Units Earned
Percentage of first-time students who complete at least nine CTE units within one
year. Filter by term and various student characteristics.
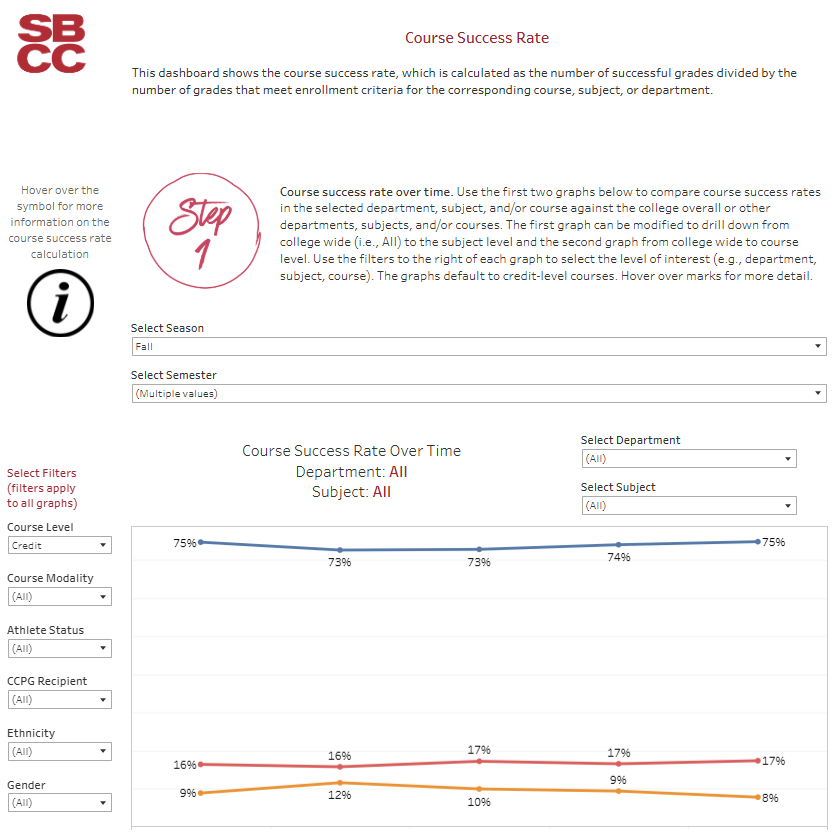
Progress - Course Success
Successful grades as a percentage of all grades. Filter by term, department, and various
student characteristics.
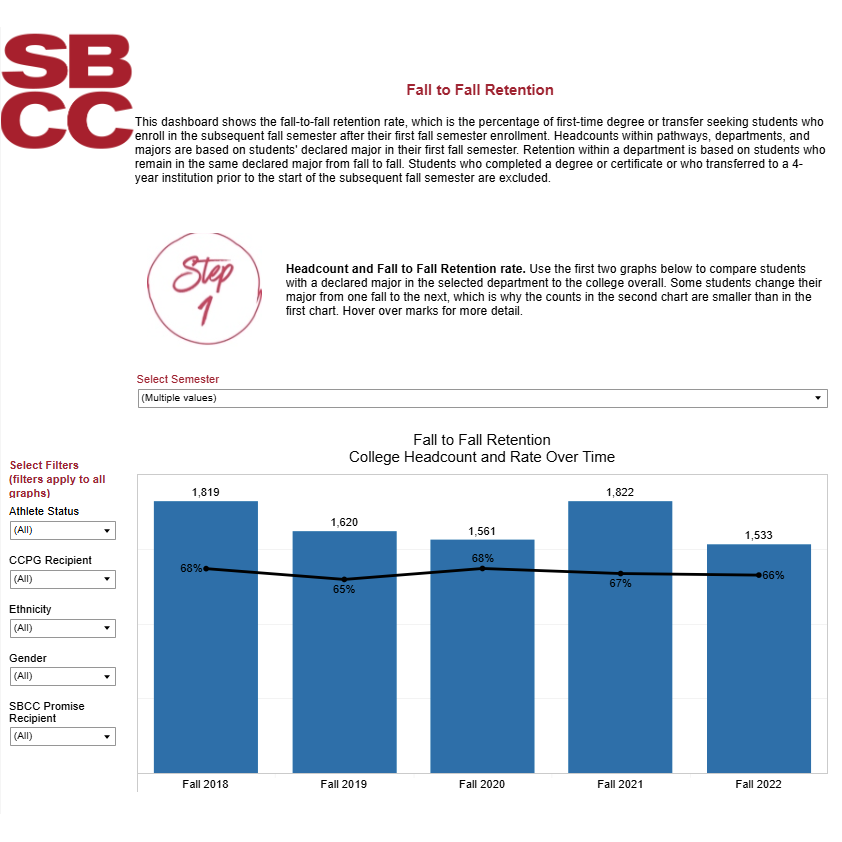
Progress - Retention Fall to Fall
Percentage of first-time degree or transfer seeking students who enroll in the subsequent
fall semester. Filter by term and various student characteristics.
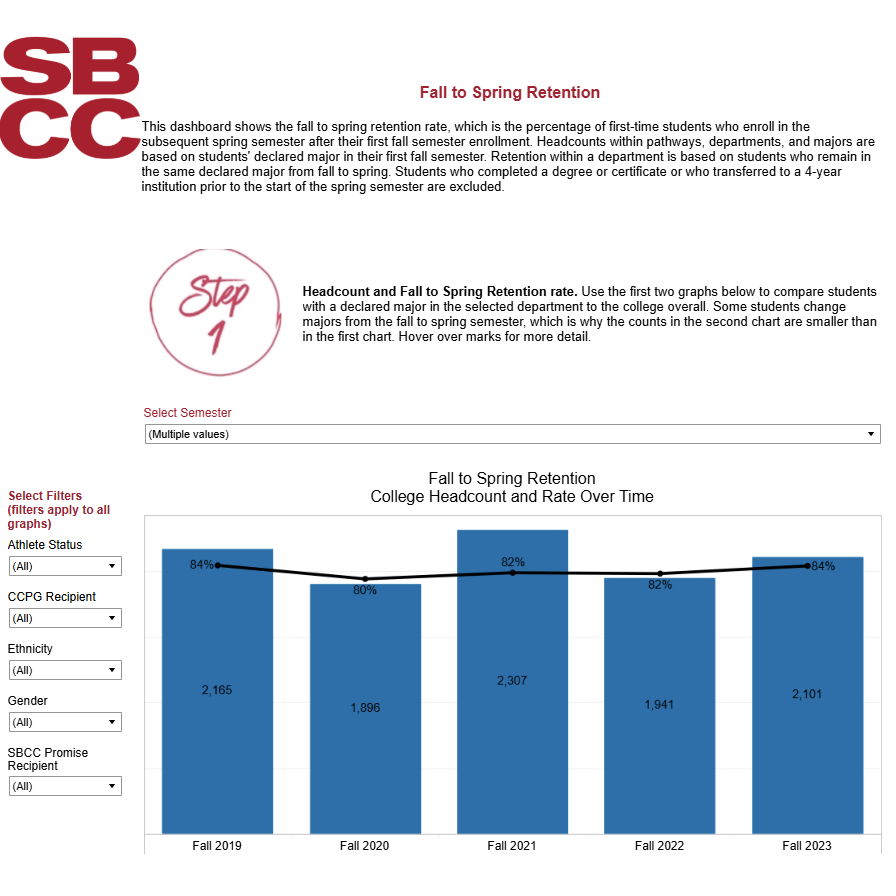
Progress - Retention Fall to Spring
Percentage of first-time degree or transfer seeking students who enroll in the subsequent
spring semester. Filter by term and various student characteristics.
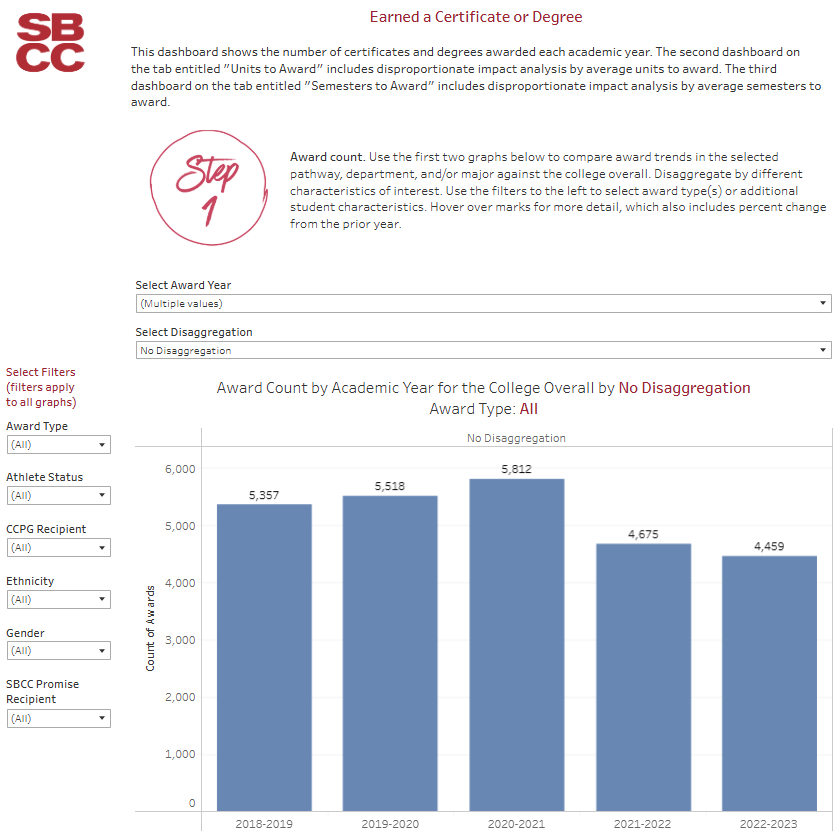
Success - Earned a Certificate or Degree
Number of certificates and degrees awarded each academic year. Filter by term, department,
and various student characteristics.
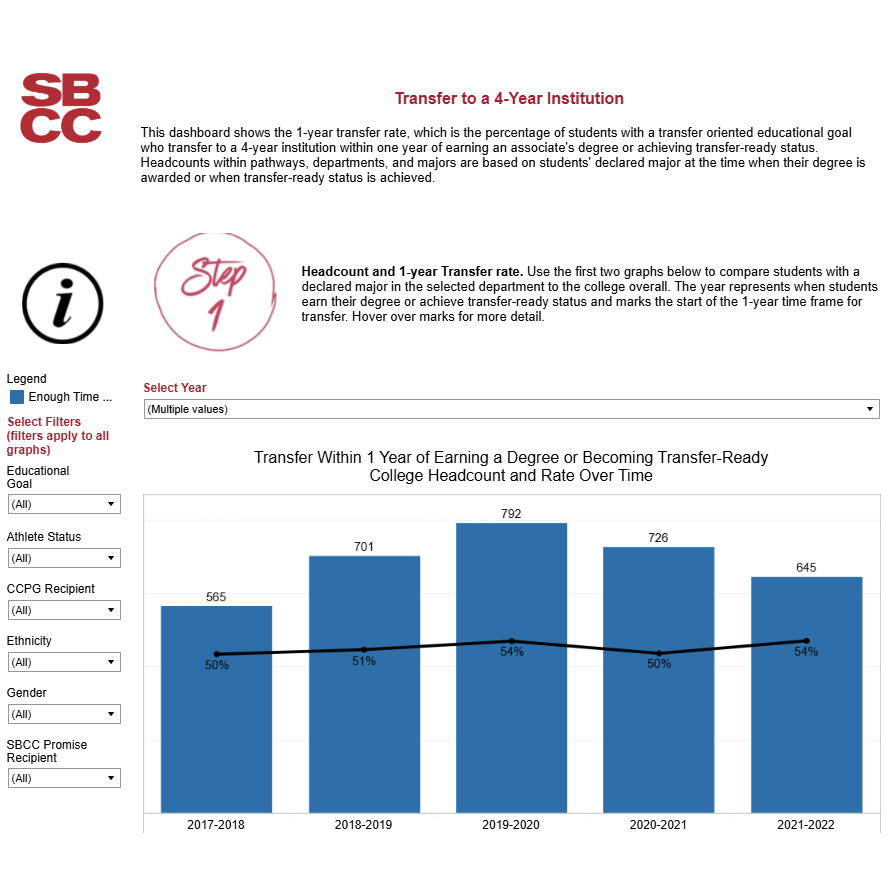
Success - Transfer to 4-Year
Percentage of transfer-oriented students who transfer to a 4-year institution within
1 year of earning a degree or achieving transfer-ready status. Filter by academic
year and various student characteristics.
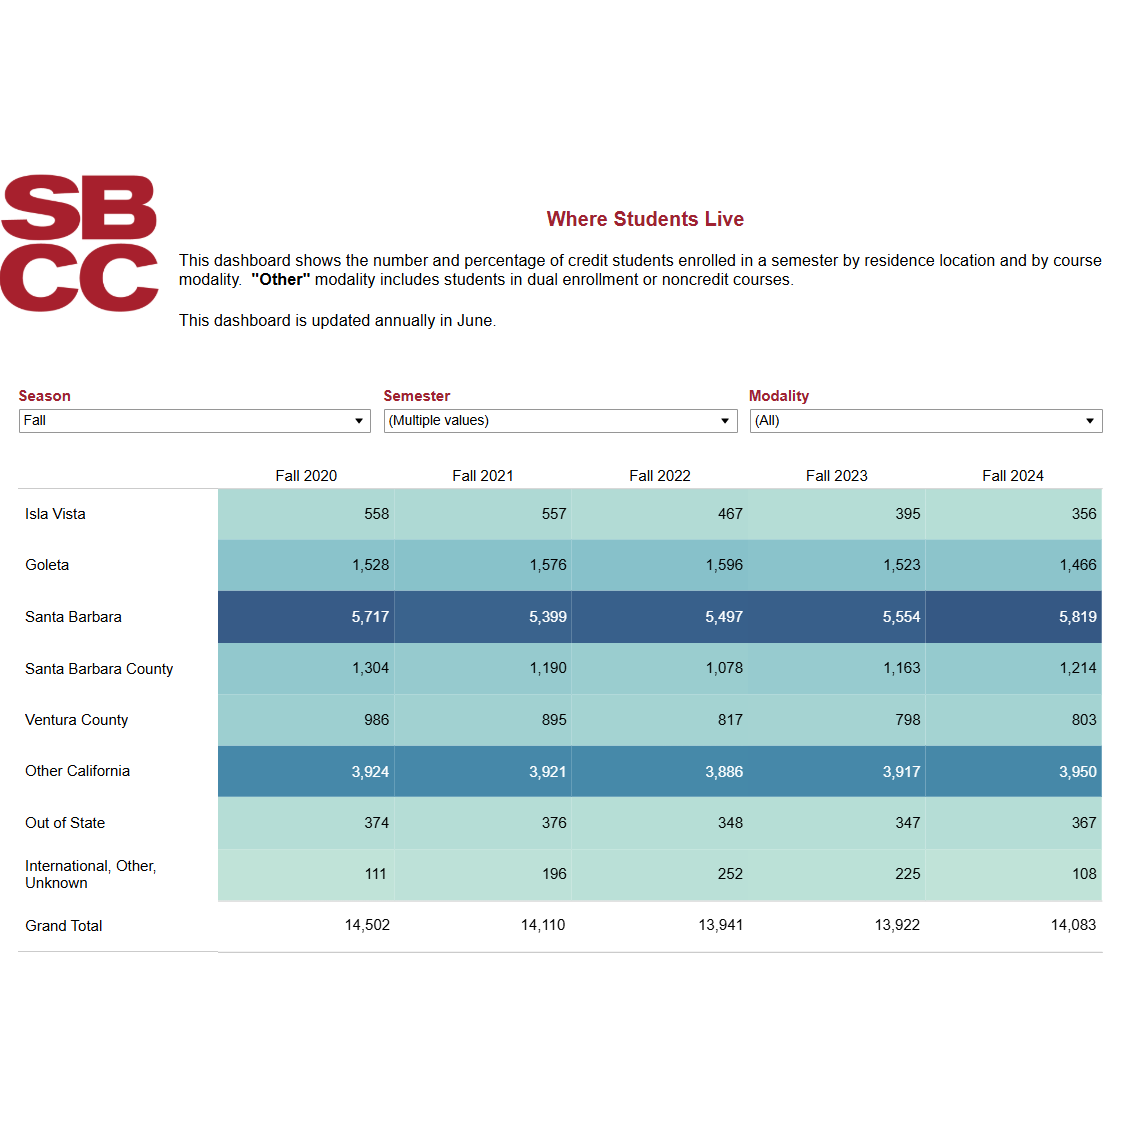
Where Students Live
Credit enrolled students by residence location and course modality.